With the Internet, it’s easy to find cool, crafty DIY projects. But often we have to buy new items for one-off projects. Why not search for projects the way we search for recipes – using materials and items that we already have in the fridge or closet?
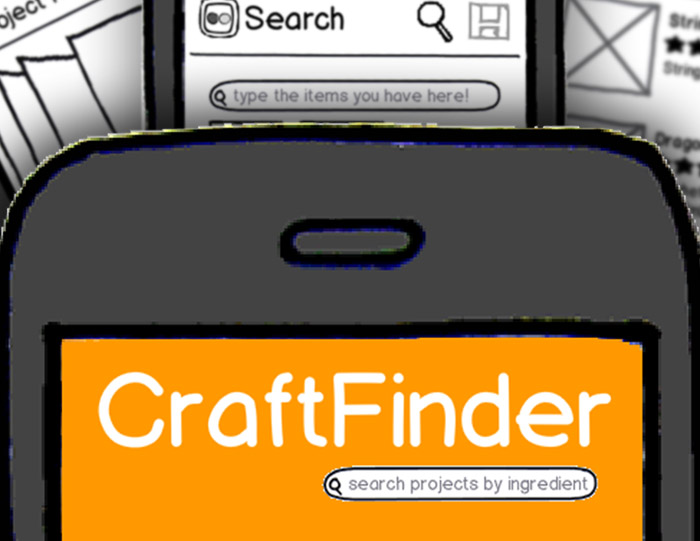
In this student project, we design and test the CraftFinder, a mobile recipe finder for DIY projects: you type in the stuff you have, and it will find and manage the projects that you can do with them.
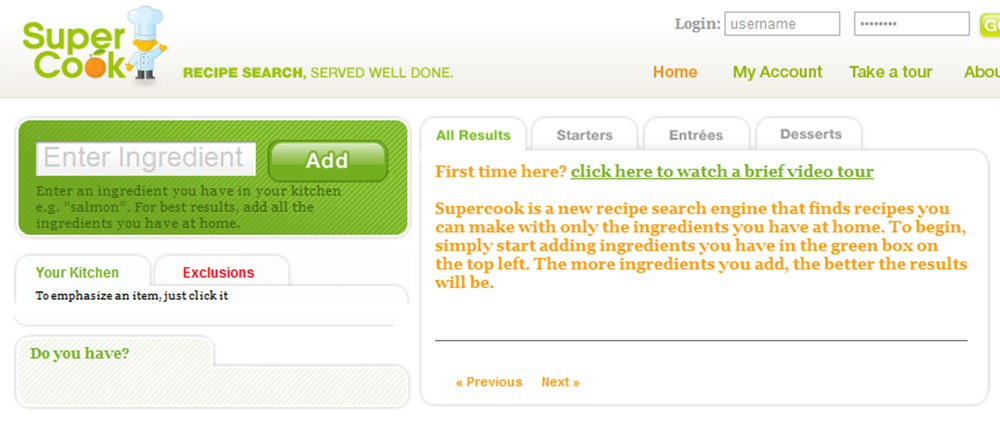
Analogous to SuperCook! Except with CraftFinder, ingredients = item and recipes = projects. CraftFinder will search the entire web for DIY projects.
Personas and Storyboards
I identified my target users: 15 – 35 year-old students, professionals and parents who enjoy creative pursuits. Based on informal conversations with friends and family, I created several personas that embody these different users: Susan, the college student; Phillip and Monica, a couple with young children; and Ben, a young professional. Each persona forms the basis of a use case scenario.
Task Analysis and Formal Specifications
I specified the early design interface on a conceptual, semantic, syntactic and lexical level. On the conceptual level, I listed the objects in the system, their attributes and relationships, and the actions that modify them; on the semantic level, I specified the parameters and feedback associated with each function; on the syntactic level, I specified the transitions between system states; on the lexical level, I specified the gestures that go with each function…
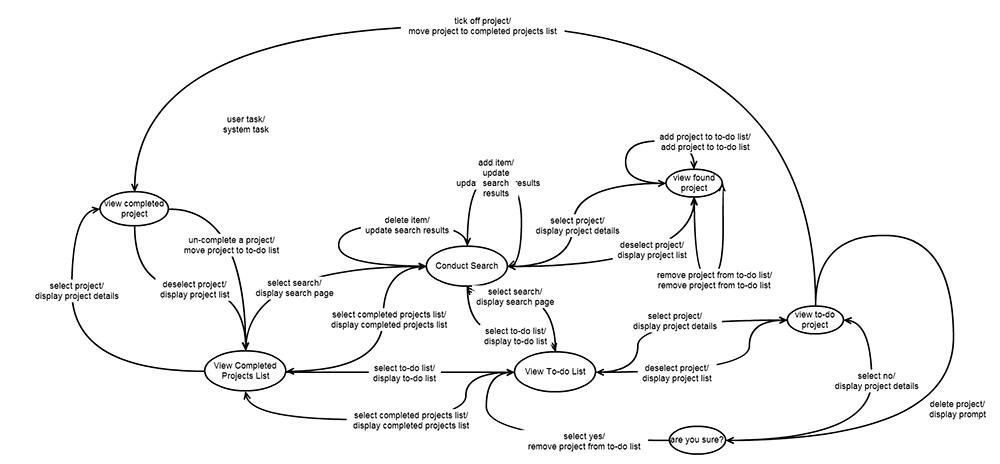
…etcetera. But only because my professor wanted me to! In hindsight, this level of specificity would have been more useful at a later stage in the process. Half the initial features didn’t make it into the final design.
Paper Prototype
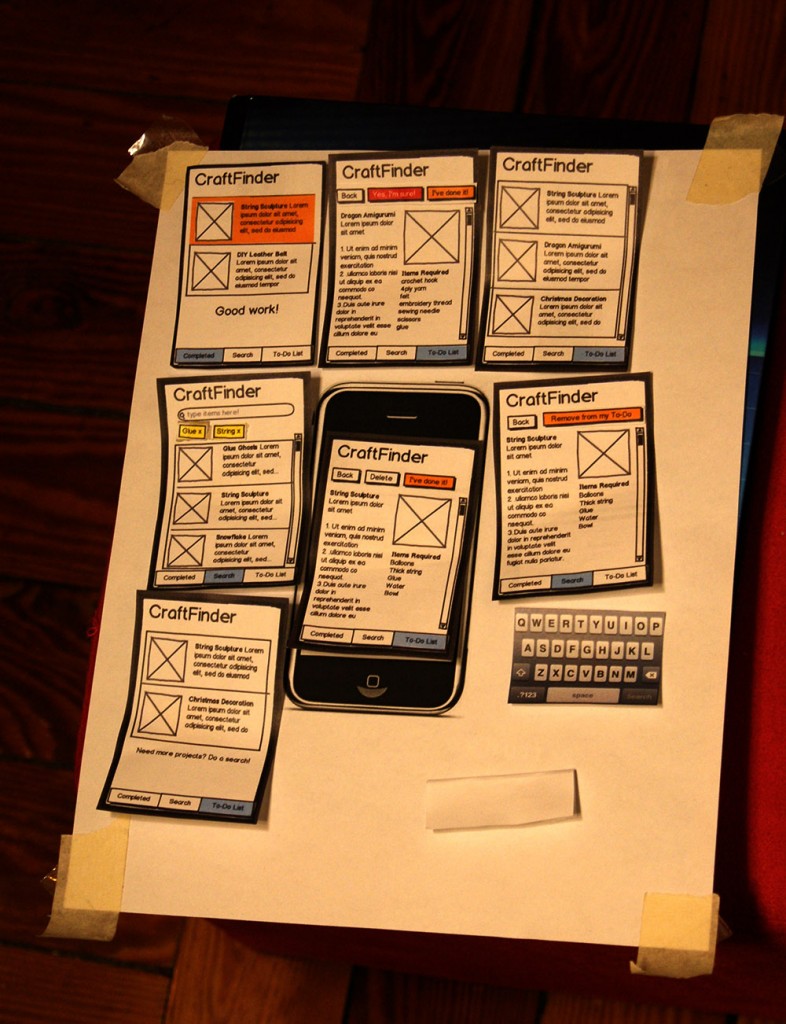
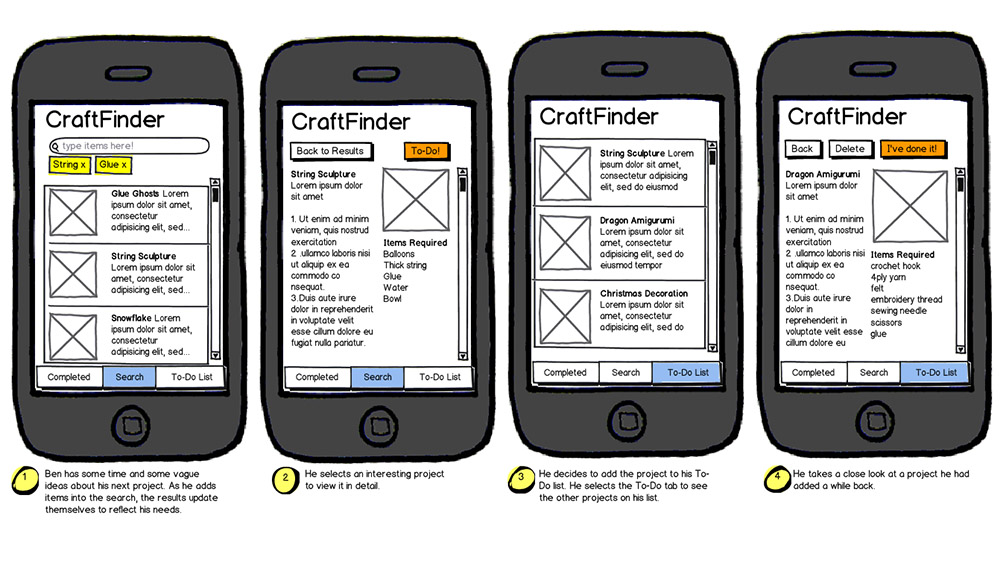
I created a quick paper prototype by printing out screens from Balsamiq and tried it out on a friend. I found that in addition to the search mechanism, the app should have a way to help you manage projects, so at first I tried a to-do list system. I straightened out some simple kinks, and convinced my classmate Jason Jacob to join me in developing this design further.
Iterative Testing
Using the storyboard, we created an interactive PowerPoint prototype. We did a quick round of usability testing on some college students. We asked them to think aloud as they completed a series of predetermined tasks based on the use case scenarios. The feedback we got showed that the items = ingredients analogy worked very well! The interface had an overly complicated navigation, however, and many users found themselves being lost in it despite the small number of screens.
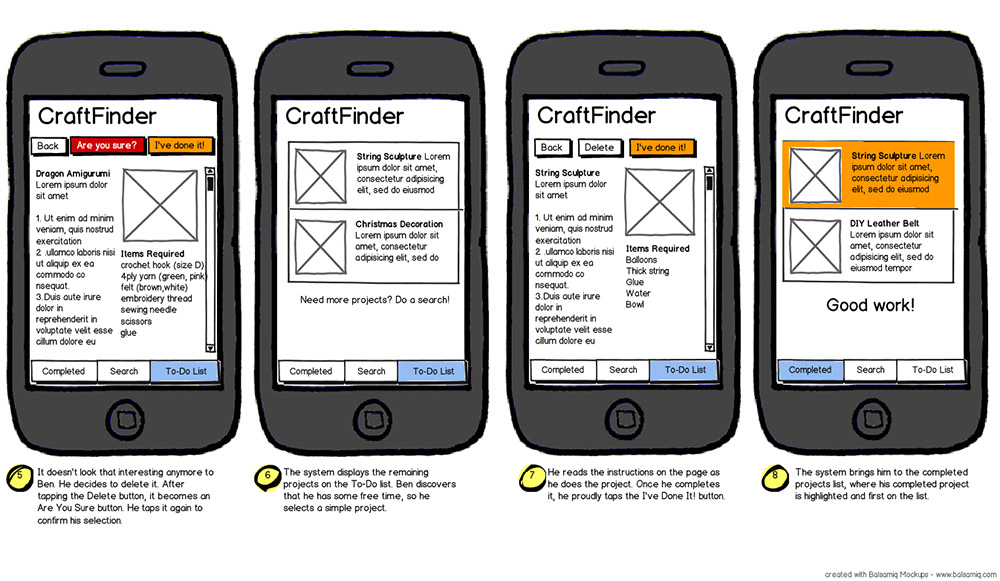
We redesigned the way projects were managed by stripping away unnecessary screens and simplifying. We also tried using icons to provide feedback and indicate object states. Then we recruited people who more closely resemble our target users by going to Tufts University’s Craft Center on a busy weeknight.
Design iteration two!
Design iteration three!
More on Design Evaluation
During both rounds of evaluation, we had several sets of metrics with which to get a sense of our participant demographics and measure the quality of our prototypes. I’ll show some examples from the second round of testing.
Prior to the usability test, we asked participants to fill in a pre-interview questionnaire with the following questions:
- General demographic questions: age, profession and field of study (if a student). This is to determine if the participant is within the target user demographic.
- Prior experience with crafting or DIY projects: this is to determine the participant’s general habits with regards to craft-finding and crafting in general. This will also help us determine if the participant is within the target user demographic.
During the test, we recorded the following metrics:
- Error rate: the number of times that a participant attempts to perform an action that does not contribute to performing the task plus the number of instances that they verbally express an incorrect interpretation of the user interface. For example, if a participant decides to go to the list of projects to check it as done instead of doing it at the project page itself, it indicates that they did not realize the latter option was available. This counts as an error. The number and type of error per task were recorded to see which portions of the interface are most confusing or commonly misinterpreted.
- Number of help requests: the number of times that the user explicitly requests for help from the experimenters (us). The number and type of help requests per task were recorded, again to see which aspects of the interface are most confusing.
We also conducted a short post-interview questionnaire with the following questions, all of which were rated on a 7-point scale:
- How confident are you that you will be able to repeat the task without help? This question helped us understand how easy the interface was to learn. As the app is geared to non-expert users, the learnability of the interface is an important metric.
- How often would you use this app in a usual month? This relates to the enjoyability of the interface, overall usability and ease of use, and actual utility of the app’s functions.
- Have you used a similar app or website to this before? This is help us determine if the participant had any prior experience with similar systems that might have affected their performance via positive or negative transfer of learning. It can also help us identify any competitors for our app.
The interface still had some kinks. For example, we used a tick icon to indicate that you have previously completed this saved project. This, however, unintentionally reminded some participants of email systems where ticks indicate selected items, awaiting some action to be applied en masse. We had assumed that whether or not a user has attempted a project before is important information, but future testing – preferably in a more ecological setting – should investigate whether this really is the case. If so, then additional capabilities such as sharing and rating projects can be investigated.
Beyond 2D: A Tangible Search User Interface
Lastly, we took a step back and asked, what if we went beyond the graphical user interface? Crafting is a tactile activity that gets you down and dirty, so a tangible user interface would dovetail nicely with the process. While you sort out your stuff and figure out what materials you have, why not be able to search for projects at the same time?
Inspired by the various tangible user interfaces presented in this paper and Google’s controversial Project Glass, we came up with a storyboard that showed what might be. I drew the illustration below with pen and paper, and used Photoshop for putting it all together.
Lessons Learnt
- There wasn’t a real need to do formal specifications, especially early on in the process. They might be more useful once a final design is decided on, and even then they should be formatted in whatever way best suits the dev team. (My professor has not worked at a startup, obviously!)
- Video demos and storyboards can be more compelling if they show the context and environment in which a system is used.
- Balsamiq (and sketching) is a great tool; people are more likely to be critical of the prototypes because they look so sketchy.
Credits
I did the first half of this project myself; the second half was done in collaboration with Jason Jacob.
Contact Me